Free shipping across Canada 2 bags or 1kg 🤩
Electric Roasted Coffee ⚡️
Free shipping across Canada 2 bags or 1kg 🤩
Electric Roasted Coffee ⚡️
Free shipping across Canada 2 bags or 1kg 🤩
Electric Roasted Coffee ⚡️
The title is perhaps a little intense, I admit. What I would like to discuss today are the variables that, according to my tests, theories and accumulated experience, will ruin or succeed a roast.
It can be difficult to unravel all the theories regarding different roasting variables and their influence on the final taste of the coffee. Some theories are intended to be basic and are very easy to prove using roasting and cupping tests, but others are based on poorly defined variables and are difficult to approach with a scientific method.
First of all, I would like to redefine certain variables in order to help explain theories related to roasting:
I think that's enough!
Here are now some relationships between the different variables which can put into context the different theories to come.
So we have the following understanding: When the beans go into the roaster, we are going to heat them up to a certain temperature. Before reaching this temperature, the coffee will crack. The time it will pass between the FC and the end as well as the end temperature itself will determine its roasting level.
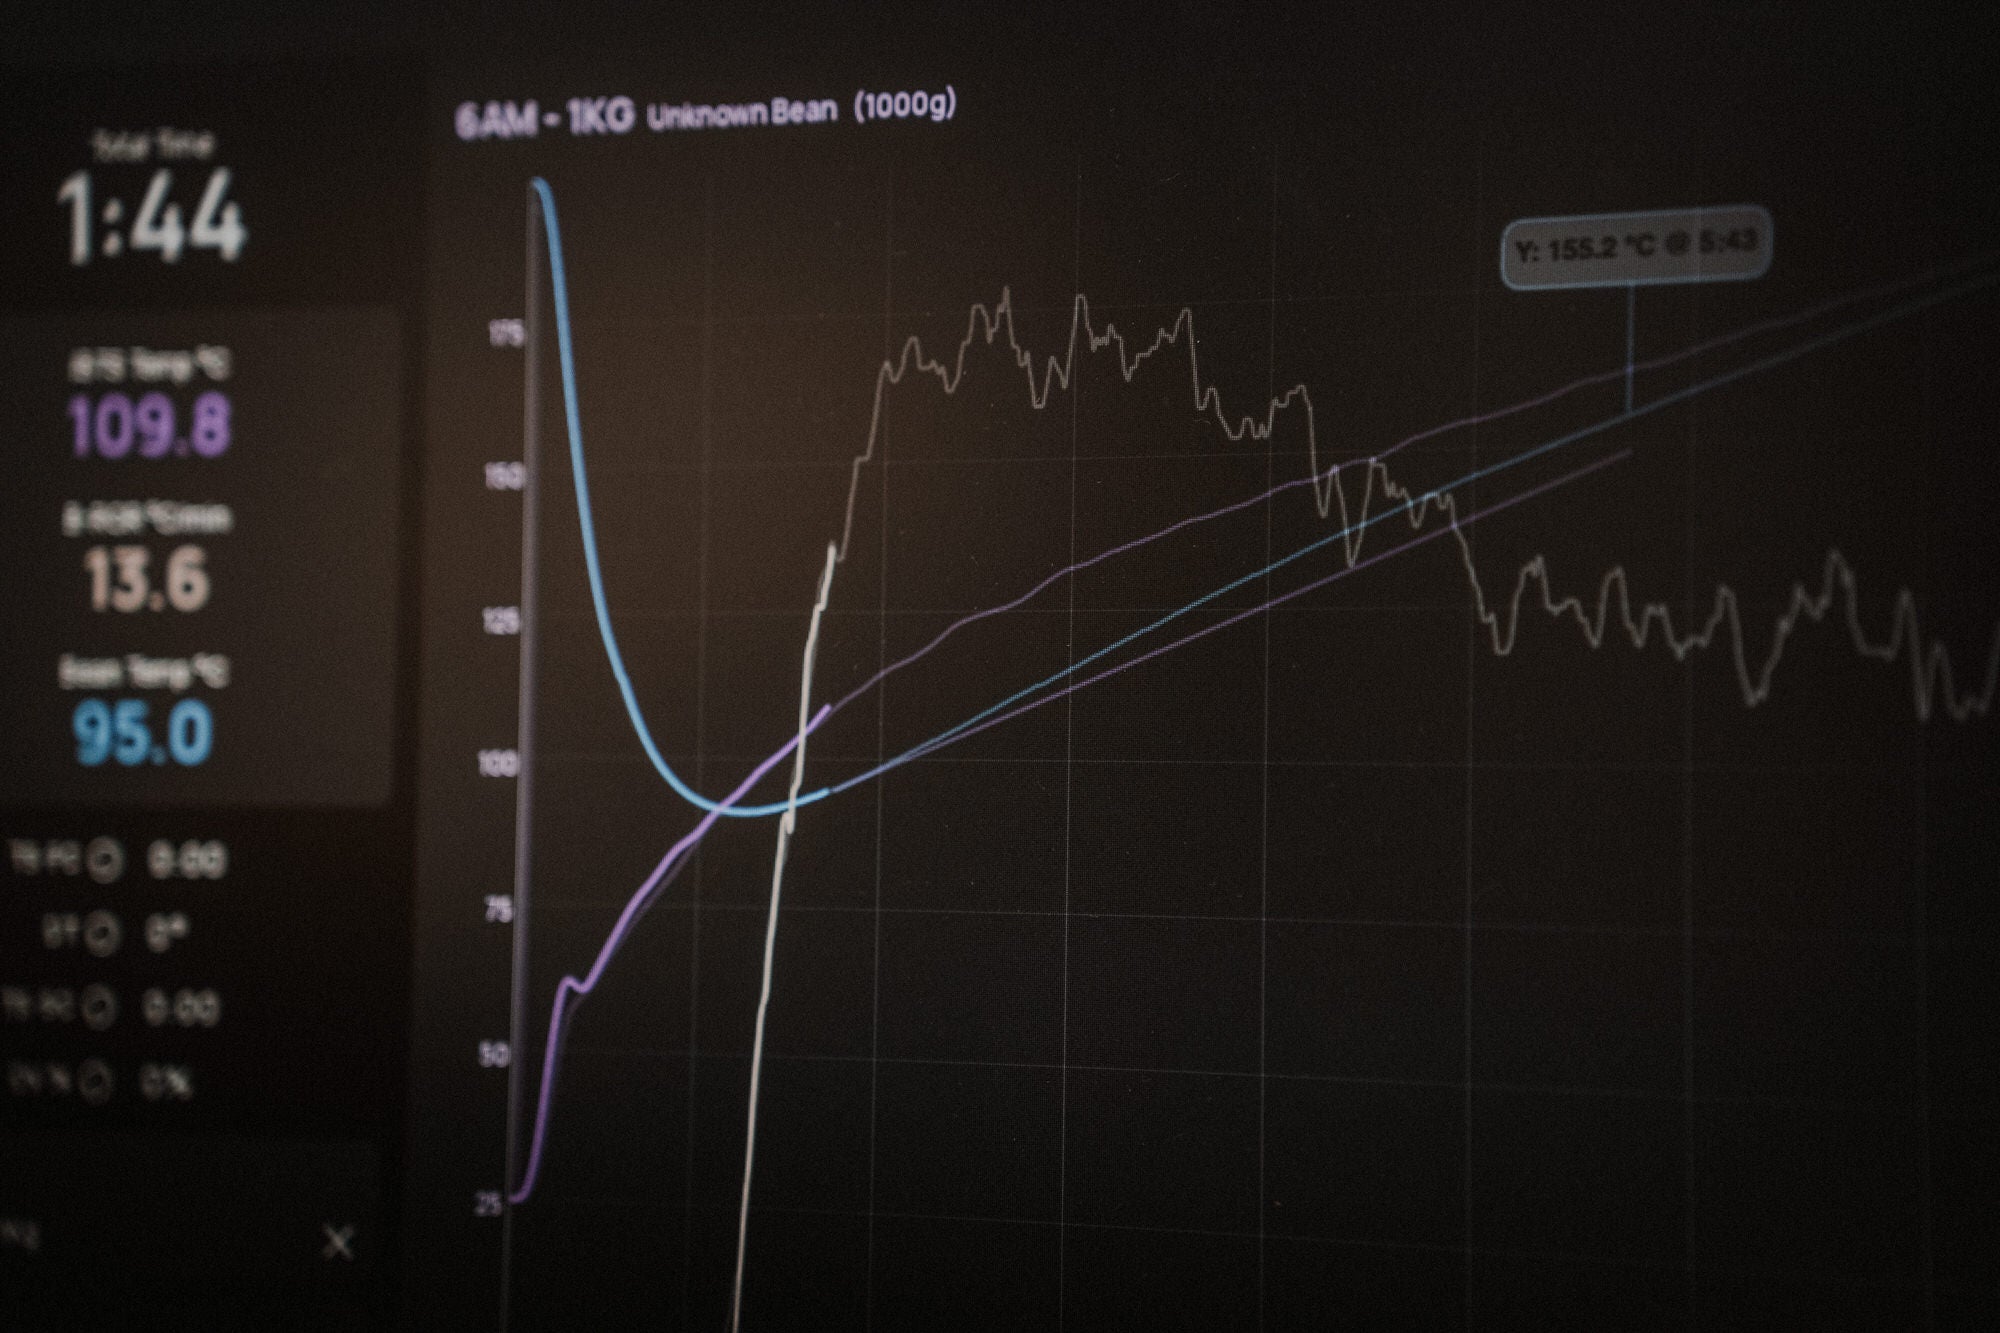
Here is a roasting profile and its results with two different curves sharing the same variable objectives: TTFC: 9min, FC @ 196 deg, DT of 2min, End temp 204. This is the same coffee, a natural anaerobic Guatemalan of a single producer.
In the first curve, we have a very standard profile with a constantly declining RoR. The temperature ended up being a little lower than expected at 203 deg. We measure 76.7 agtron for the ground color.
In the second curve, we have a very non-standard profile where we start very quickly, slow down and then pick up speed to arrive at the FC at the same time and have exactly the same development profile. The DT is the same but the temperature ended up slightly higher at 205 deg. We measure 75.5 agtron for the ground color. Unsurprisingly, slightly darker than the first curve
The weight loss is exactly the same on the 2 batches at 15.3%.
We did a blind cupping with the 2 coffees. Both seemed not developed enough for my taste, a little too acidic (I usually roast this coffee with 2min45 of development but for the good of the cause I reduced that to 2min). We clearly taste the fermentation and the anaerobic side. A little lemon or sour orange. The important point is that we were never able to differentiate what the 2 coffees had that was different. They may not have been identical (what coffees really are?) but their profile, their body, their aromas were exactly the same. One thing is certain, we could not correctly associate them with their curve.
At first glance, here is what we could conclude from this test: By keeping a constant development time as well as a constant end temperature, we can obtain the same color as well as the same final taste profile. By the almost identical similarity between the two coffees, it can be inferred that the temperature behavior before the FC does not greatly affect the final cup. Contrary to the theory that RoR should always be in decline, our tests demonstrate that a RoR hole before FC does not (or almost does not) affect the final cup.
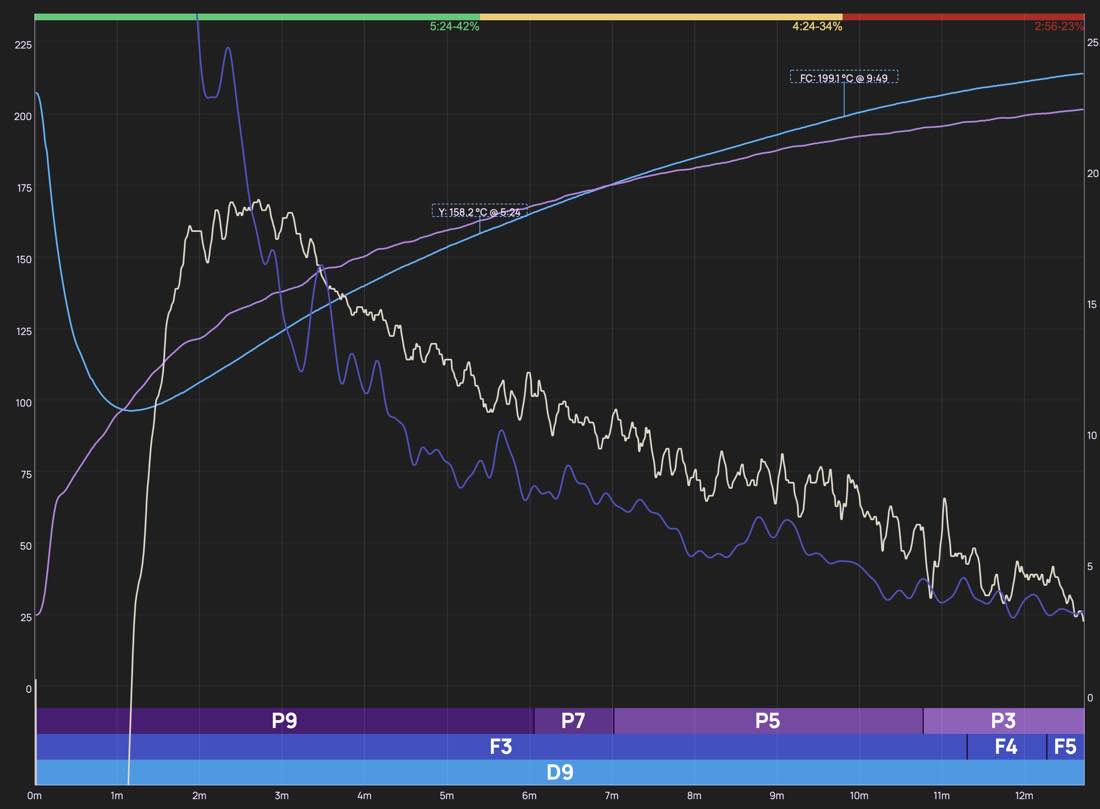
Here is a second test from the same perspective with a different coffee and a different profile: TTFC: 8min30, FC @ 196 deg BT, DT of 3min, End temp 210 BT. It is all the same coffee, a natural Brazilian cooperative.
The first batch obtains a color of 81.9 agtron following a standard curve with a declining RoR.
The second batch obtains a color of 81 agtron by following the same concept of the first test, deliberately creating a hole in the RoR before the FC and then following the same curve for the development time. The curve after the FC was not perfect, the RoR had a small rise towards the end and brought us to a slightly higher temperature at 211.5 deg BT, which explains the slightly darker color.
For the third batch, we tried something to confirm our theory: Create a hole in the RoR AFTER the FC. So we tried to follow the same variables by having a declining RoR before the FC and creating the hole directly during development. It was rather difficult to stay faithful to the 3min of DT and 210 deg of end, we rather finished at 3min12 of DT and 208.2 deg BT of end. The color is 86 agtron (slightly paler than the other 2).
We did a blind cupping with the 3 coffees, here are the results. Without any hesitation, the first 2 batches are identical. Ultimately, we find that the second batch has slightly more chocolate flavors and slightly less acidity. This would be explained by the slightly higher end temperature. The third batch is a different story. No particular aroma, very watery, flat, disappointing. A little too much acidity and obvious astringency. To refer to our article on roasting errors, it is definitely a coffee that has “baked” or that has had a stagnant temperature which destroys the interesting aromas. I would never have served coffee #3 to my customers. The first two on the other hand were super interesting and did not present any apparent roasting errors.
We can consider that the theory we had regarding the RoR before the FC turns out to work in this test as well. The first 2 coffees have an almost identical taste profile and yet have a completely different curve before the FC. The development time as well as the end temperature are therefore really determining the final taste. Test 3, on the other hand, taught us that a curve with a declining RoR is important AFTER the FC. Indeed, if the RoR drops too low and then has to rise again to reach the desired end temperature, we create a cooking phenomenon which destroys the interesting aromas and pronounces astringency, exactly as if we were to stagnate our temperature.
After all that, one observation remained in my mind: These tests have several things in common: The end temperature, the development time as well as the total time. The question begged: Is the point of impact really the development time or could it just be the total roast time, regardless of when the coffee cracks?
We took the natural anaerobic Guatemalan and conducted a third test with this coffee: Keep the same development time, the same RoR descending curve after the FC and the same end temperature but get to the FC more quickly.
This third batch therefore took 7min39 to get to the FC (1min24 less than batch 1) and then had a development time of 2min and an end temperature of 204.3 BT (1.4 deg more than batch 1). We are therefore on an identical profile to batch 1 but with a TTFC of 1min24 less.
We redid a blind-cupping of the 3 coffees. The three coffees have an almost identical profile. Batch 1 and 2 are still as identical as before and batch 3 blends into the background. Same flavor profile with a touch of lemon. We weren't able to match any coffee to its curve, they actually tasted identical.
In short, we confirm that, according to our tests, the development time and the final temperature are the 2 variables that allowed us to create consistency in our roasts. With an appropriate development time, an appropriate final temperature and a development time without stagnation in temperature, we arrive at a super interesting and aromatic profile.
In short, the aim of this article was to define the heartstrings of roasting. We have long tried to create perfect curves with a RoR that descends smoothly, we have often tried to find the ideal loading temperature so as not to make marks on the grains, etc. In the end, what really proved useful and what helped create near-perfect roasts shot after shot was the development time and final temperature.
Learn to control what happens after the FC and manage the power so as not to arrive with too much energy at the FC and you will probably have more control over your final profile.
Ultimately, the best coffee is the one you prefer. In my opinion, the most important thing is not necessarily creating the “perfect coffee” but rather understanding how to get it to what you want to achieve and being able to reproduce it batch after batch with confidence. By understanding the causes and effects of each variable, we are able to better adapt and adequately aim for our objective.
Some observations to take into account when following our test results:
DTR is not necessarily reliable data. As we have seen, development time does not necessarily have to be related to total time. That said, the development time ratio (DTR) is therefore not reliable data. To prove this, batches 1 and 3 of the Guatemalan coffee were virtually identical in taste and yet had a DTR of 18% and 20% respectively, which is a pretty big difference.
What happens before the FC is not necessarily harmless . We haven't really addressed the question of the starting temperature at which we heat the roaster. It is also very important for successful roasting since too high a temperature can burn the beans (scorch in English) and create astringency. This is a very different variable for each machine but try to find a temperature that works well for you. Not too low nor too high.
Weight loss . We also observed that for all our tests, the weight loss was constant. Although this data does not give us any idea about the behavior of the roast and the final cup result, it can be used to confirm that all batches follow a certain consistency. It is a good practice to always measure the weight loss of a coffee after each batch and to perhaps question its consistency if you obtain a value that is really far from what you usually get.
Data is always subjective to the situation . You would think an easy path to learning how to roast and rely on someone else's data and copy it. It's not that easy. Just remember that all temperature and time data is always subjective to the machine you are using. A single conduction roaster will behave differently from a convection roaster. A 20kg roaster will not have the same behavior as a 2kg one. The thermometers used can sometimes be placed in different locations which will give readings to be interpreted differently. In short, digesting the theory but taking the data with a grain of salt seems fair to me.
Freshly electric roasted specialty beans

An affordable specialty coffee from Brazil. Medium roast with comforting chocolate aromas. Ideal for a well-balanced, smooth, and comforting espresso.
Eldorado is produced by the Barbosa farm in Brazil, a partner of Nucleus for 3 years now.
Comments
There are no comments.
Your comment